-
Sample size calculation for case-control study
To do a sample size calculation, you can use the online sample size calculator available at: http://www.math.uiowa.edu/~rlenth/Power/

Worker example
Scenario 1:
"S-Syndrome (SS)" is characterized by profound irritability, disorientation and fatigue for those infected individuals. The efficacy of a vaccine (called "BG vaccine") in preventing adulthood SS remains uncertain, and a study is designed to compare the vaccination coverage rates in a group of MPH students infected with SS and a group of controls with equal sample size. Available information indicates that approximately 30% of the controls are vaccinated. The primary investigator plans to have an 80% chance of detecting an odds ratio significantly different from 1 at the 5% level of significance. If an odds ratio of 2 would be considered an important difference between the two groups, what should the sample size be included in each study group?
Assumptions
Level of significance: 0.05 Statistical power required: 0.8
This can be rearranged as
 ?
? 
Sample size calculations
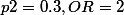
Enter p1=0.462, p2=0.3, alpha=0.05.
Adjust sample size until reaching desired power.
Sample size in each group: 152 Total sample size: 304
Scenario 2
If number of cases is limited to 100, untick "Equal ns", set n1=100, and increase n2 until the power reaches 80%.
The required sample sizes are 100 cases and 293 controls to reach 80% power for OR of 2.
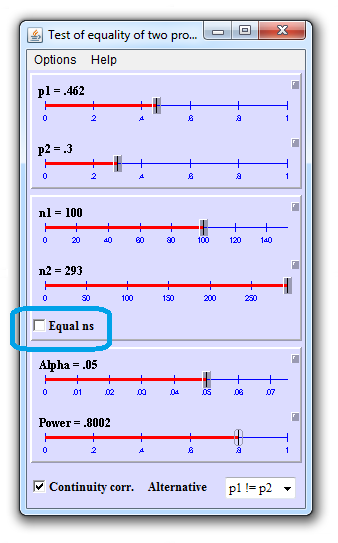
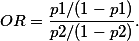
If effect sizes smaller than OR = 2 are of interest, the sample size would be larger. Use the formula shown previously to calculate p1, based on particular values of p2 and OR.
-
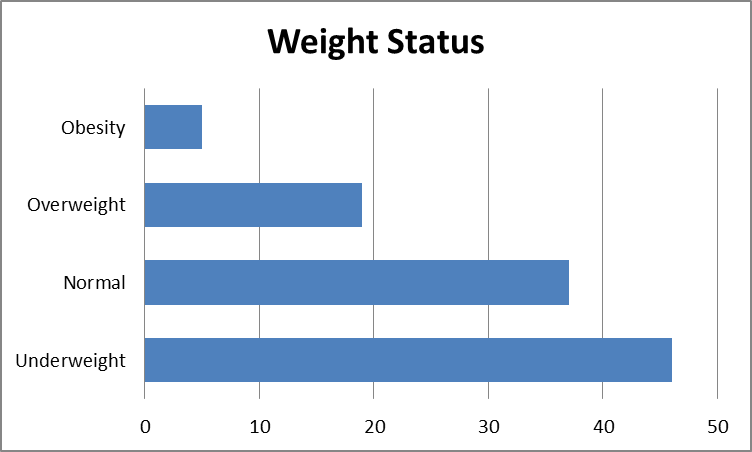
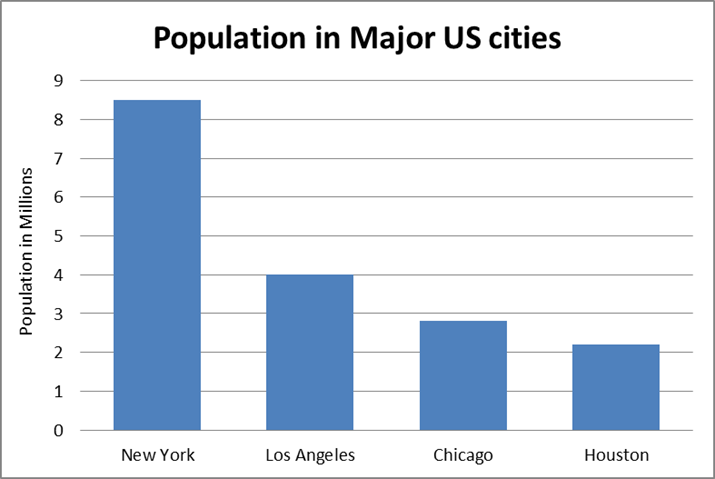
Bar Chart
- Presents grouped data with rectangular bars with lengths proportional to the values that they represent
- Can be plotted vertically or horizontally
- Very useful for recording discrete data and show comparison
 |
 |
-
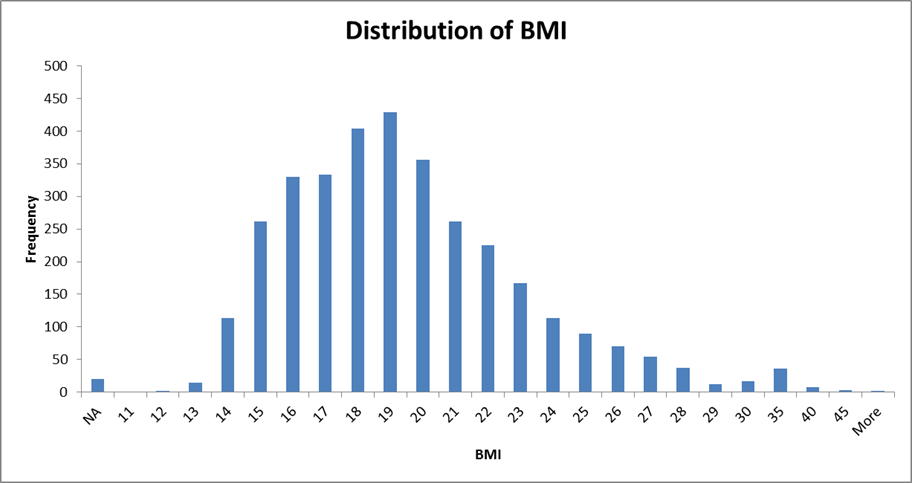
Histogram
- Represent the distribution of numerical data
- Use for continuous data, where the bins represent ranges of data
-
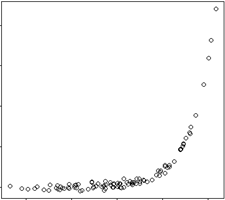
Scatter Plot
- Display values for two variables for a set of data
 |
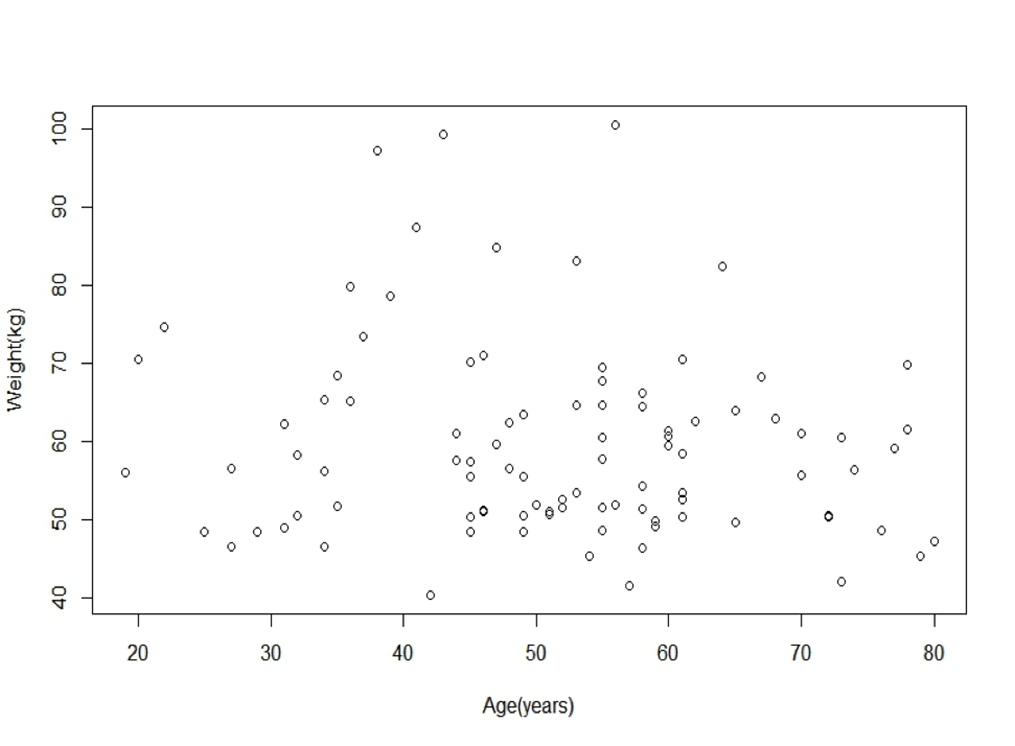 |
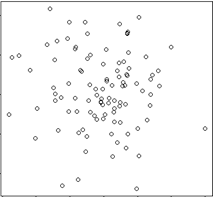
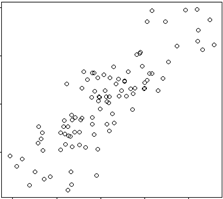
- Suggest various kinds of correlations between variables
- Ability to show nonlinear relationship between variables
 |
 |
 |
||
| Uncorrelated |
High positive correlated |
Low positive correlated |
||
 |
 |
|||
|
Negative correlated |
Non-linear relationship |
-
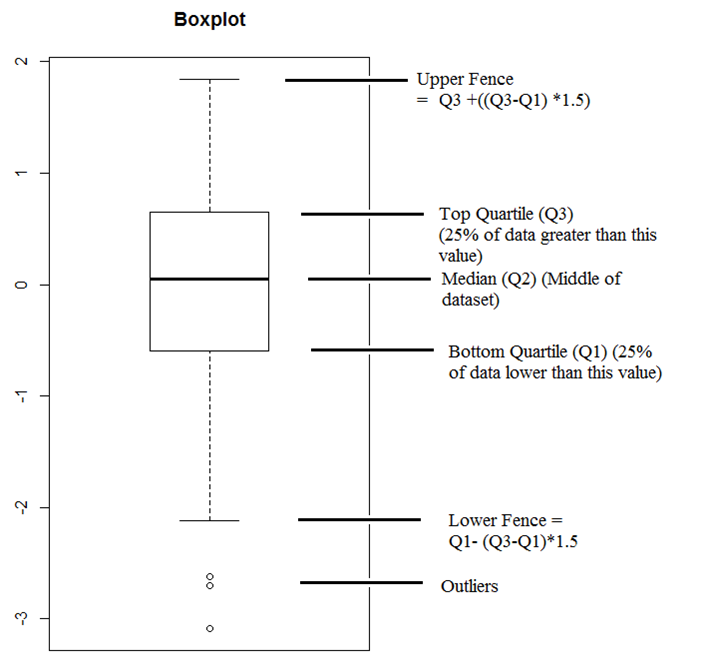
Box Plot
- Show descriptive statistics
- Ourliers may be plotted as individual points
- Display variation in samples of a statistical population without making any assumptions of the underlying statistical distribution.
- Spacings between the different parts of the box indicate the degree of dispersion (spread) and skewness in the data, and show outliers.
How to understand a Boxplot
-
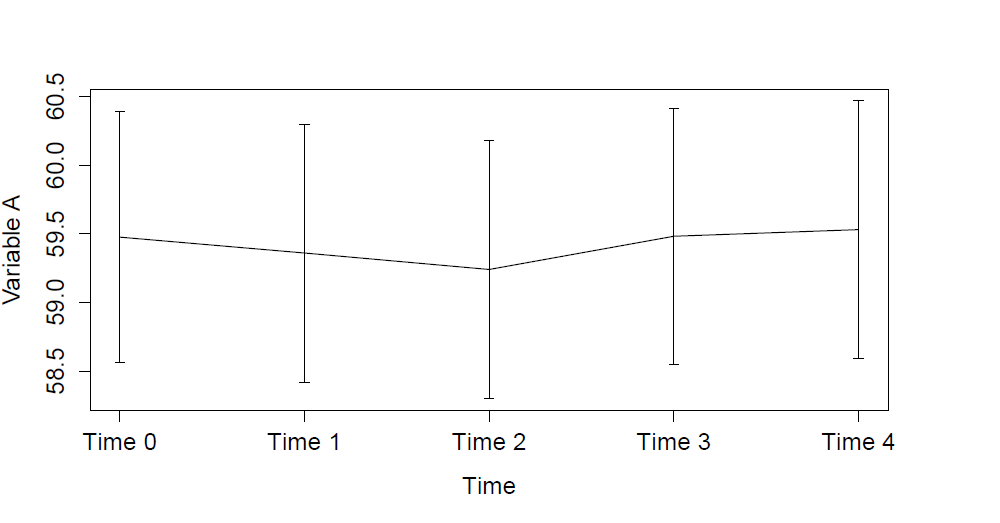
Means and Error Plot
- represent of the mean and variability of data
- represent the overall distribution of the data